Sensor Motion
Python package for analyzing sensor-collected human motion data (e.g. physical activity levels, gait dynamics).
Dedicated accelerometer devices, such as those made by Actigraph, usually bundle software for the analysis of the sensor data. In my work I often collect sensor data from smartphones and have not been able to find any comparable analysis software.
This Python package allows the user to extract human motion data, such as gait/walking dynamics, directly from accelerometer signals. Additionally, the package allows for the calculation of physical activity (PA) or moderate-to-vigorous physical activity (MVPA) counts, similar to activity count data offered by companies like Actigraph.
Requirements
This package has the following dependencies, most of which are just Python packages:
- Python 3.x
- The easiest way to install Python is using the Anaconda distribution, as it also includes the other dependencies listed below
- Python 2.x has not been tested, so backwards compatibility is not guaranteed
- numpy
- Included with Anaconda. Otherwise, install using pip (
pip install numpy)
- Included with Anaconda. Otherwise, install using pip (
- scipy
- Included with Anaconda. Otherwise, install using pip (
pip install scipy)
- Included with Anaconda. Otherwise, install using pip (
- matplotlib
- Included with Anaconda. Otherwise, install using pip (
pip install matplotlib)
- Included with Anaconda. Otherwise, install using pip (
Usage
Here is brief example of extracting step-based metrics from raw vertical acceleration data:
Import the package:
import sensormotion as sm
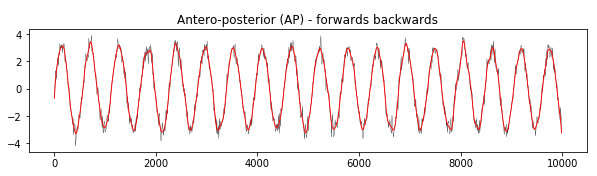
If you have a vertical acceleration signal x, and its corresponding
time signal t, we can begin by filtering the signal using a low-pass
filter:
b, a = sm.signal.build_filter(frequency=10,
                              sample_rate=100,
                              filter_type='low',
                              filter_order=4)

x_filtered = sm.signal.filter_signal(b, a, signal=x)
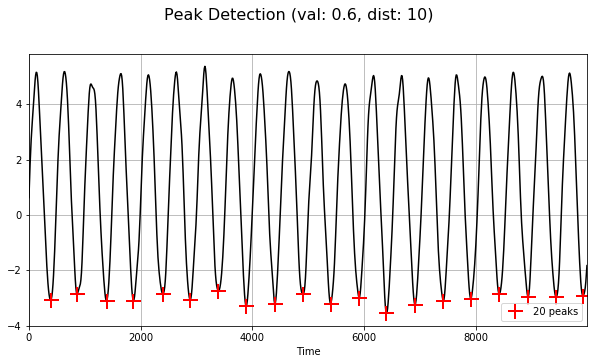
Next, we can detect the peaks (or valleys) in the filtered signal, which gives us the time and value of each detection. Optionally, we can include a plot of the signal and detected peaks/valleys:
peak_times, peak_values = sm.peak.find_peaks(time=t, signal=x_filtered,
                                             peak_type='valley',
                                             min_val=0.6, min_dist=30,
                                             plot=True)
From the detected peaks, we can then calculate step metrics like cadence and step time:
cadence = sm.gait.cadence(time=t, peak_times=peak_times, time_units='ms')
step_mean, step_sd, step_cov = sm.gait.step_time(peak_times=peak_times)
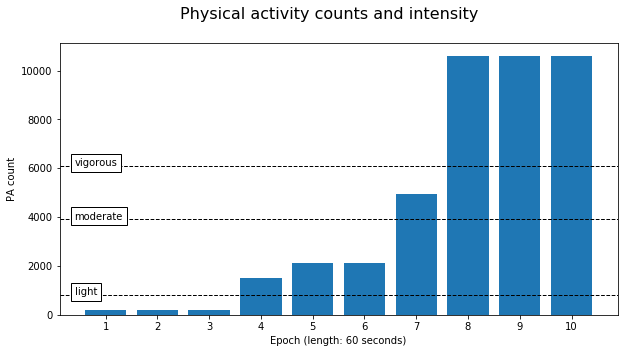
Physical activity counts and intensities can also be calculated from the acceleration data:
x_counts = sm.pa.convert_counts(x, time, integrate='simpson')
y_counts = sm.pa.convert_counts(y, time, integrate='simpson')
z_counts = sm.pa.convert_counts(z, time, integrate='simpson')
vm = sm.signal.vector_magnitude(x_counts, y_counts, z_counts)
categories, time_spent = sm.pa.cut_points(vm, set_name='butte_preschoolers', n_axis=3)
For a more in-depth tutorial, and more workflow examples, please take a look at the tutorial.
I would also recommend looking over the documentation to see other functionalities of the package.
Contribution
I work on this package in my spare time, on an “as needed” basis for my research projects. However, pull requests for bug fixes and new features are always welcome!
Please see the develop branch for the development version of the package, and check out the issues page for bug reports and feature requests.
Getting Help
You can find the full documentation for the package here
Python’s built-in help function will show documentation for any module
or function: help(sm.gait.step_time)
You’re encouraged to post questions, bug reports, or feature requests as an issue
Alternatively, ask questions on Gitter